

What’s going on with Hong Kong 50 Index?
Those of you that are trend followers are probably eagerly watching Hong Kong 50 Index to see if its latest 3.5% move continues. If not, the mean-reversion people out there will be delighted with this exceptionally large 2 days move.
What’s going on with Hong Kong 50 Index?
Those of you that are trend followers are probably eagerly watching Hong Kong 50 Index to see if its latest 3.5% move continues. If not, the mean-reversion people out there will be delighted with this exceptionally large 2 days move.

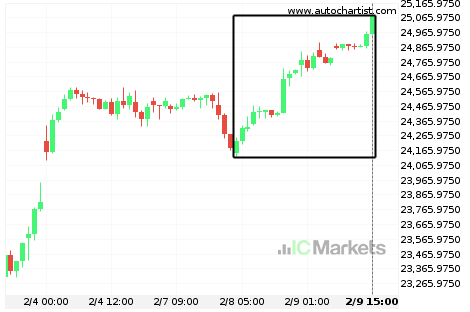
Important price line breached by Hong Kong 50 Index
Hong Kong 50 Index has broken through 24561.4004 which it has tested numerous times in the past. We have seen it retrace from this price in the past. If this new trend persists, Hong Kong 50 Index may be heading towards 25035.1191 within the next 3 days.
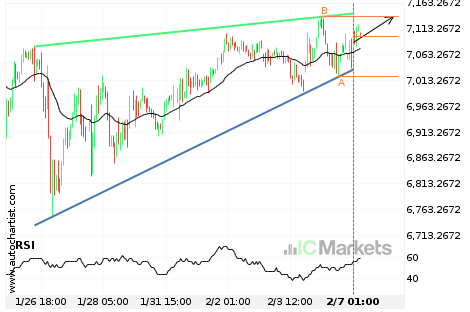
Should we expect a breakout or a rebound on Australia 200 Index?
The movement of Australia 200 Index towards the resistance line of a Rising Wedge is yet another test of the line it reached numerous times in the past. This line test could happen in the next 3 days, but it is uncertain whether it will result in a breakout through this line, or simply rebound […]
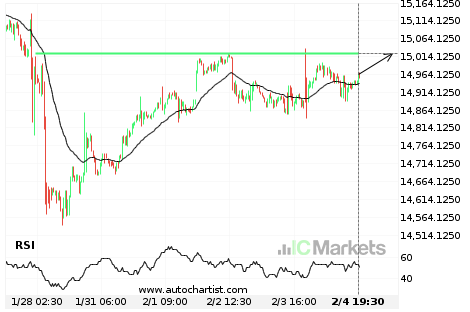
FTSE China A50 Index approaching important 15022.0400 price line
FTSE China A50 Index is approaching the resistance line of a Resistance. It has touched this line numerous times in the last 8 days. If it tests this line again, it could do so in the next 2 days.

FTSE China A50 Index approaching important 15022.0400 price line
FTSE China A50 Index is approaching the resistance line of a Resistance. It has touched this line numerous times in the last 8 days. If it tests this line again, it could do so in the next 2 days.

Hong Kong 50 Index has broken through resistance
Hong Kong 50 Index has broken through a resistance line. It has touched this line at least twice in the last 15 days. This breakout may indicate a potential move to 24639.6453 within the next 2 days. Because we have seen it retrace from this position in the past, one should wait for confirmation of […]
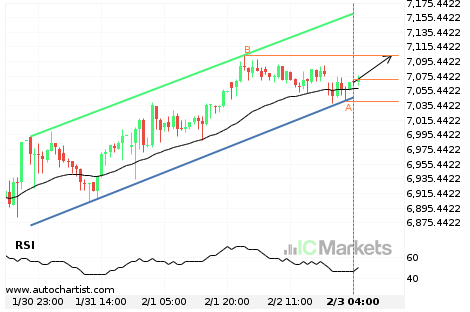
Should we expect a breakout or a rebound on Australia 200 Index?
The movement of Australia 200 Index towards the resistance line of a Channel Up is yet another test of the line it reached numerous times in the past. This line test could happen in the next 2 days, but it is uncertain whether it will result in a breakout through this line, or simply rebound […]

Should we expect a breakout or a rebound on Australia 200 Index?
The movement of Australia 200 Index towards the support line of a Rising Wedge is yet another test of the line it reached numerous times in the past. This line test could happen in the next 16 hours, but it is uncertain whether it will result in a breakout through this line, or simply rebound […]